
Week 12: Final reflection
In this blog post I will attempt to synthesise my thoughts on the data visualisation assignment across the three learning blocks.
My enrolment on the Critical Data in Education course arose out of some interesting debates I had earlier in the year with my brother, who works in sales for one of Googles data analytics subsidiaries, Lookr. While we were discussing the merits and malpractices of big tech in education, he admitted that he had not put much thought in to Data or its analysis past being able to sell it. This prompted me to consider what exactly data is and how it is increasingly being used to define us in the digital age.
As a maths teacher, I had traditionally viewed data in what Williamson (2017) refers to as the etymological sense – its Latin root dare signifying that it was something ‘given’, the raw elements and information that surrounds us from which we can extrapolate meaning.
I was drawn to Williamson’s definition of data as a ‘social product’ in that we use the term in a modern sense to refer to that which is captured, not given. Data is the product of what is harvested from that which is available, and so it is by nature partial, selective and representative of the contexts and methods by which it is created. (Williamson, 2017)
Key themes explored during the course
Datafication & Personalised Learning
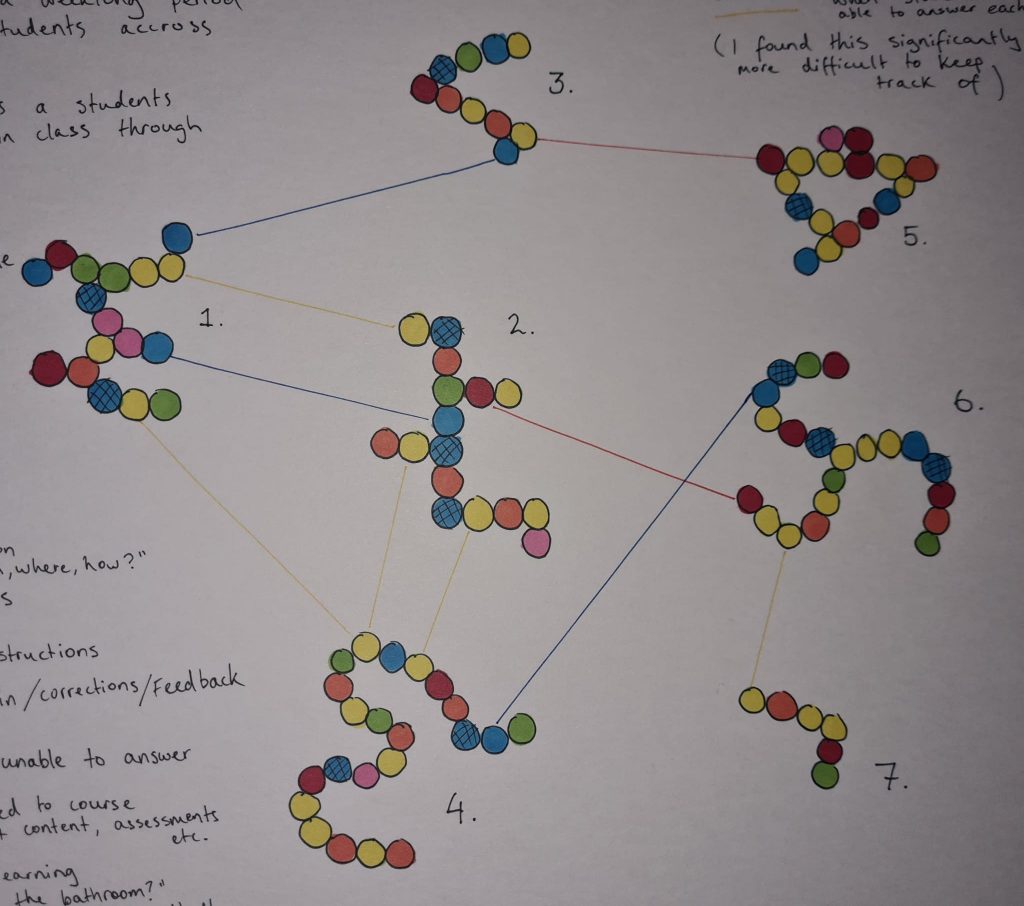
One of the key focuses in the first block was on ‘datafication of education’, which refers to the ways in which intensive data processing is increasingly pervading and reshaping formal educational activities (Knox, Williamson & Bayne 2019) The readings allowed me to investigate the ways in which many emerging data-driven technologies utilise information harvested from students or ‘learners’ to provide ‘personalised’ learning experiences. This was especially significant and interesting for me as a secondary teacher as it has major implications for the automation of my profession. My exploration of datafication, personalised learning and subsequent data visualisation of the dialogue between teacher and student led me to agree with Tsai, Perotta and Gasovic (2019) that‘Learning analytics should leverage rather than replace human contact’.
Data literacy & power
The datafication of education and its resultant new data systems raised many questions about ‘digital literacy’, which refers to the competence of both educators and students to understand and make use of this data. I felt that this theme synthesised very nicely with the data visualisation task, as the visualisations by their very nature are designed to make data more easily accessible and legible. However, we explored Data literacy on a deeper level to examine it not just as a skillset, but also as a more critical approach that enables students as well as teachers to interrogate and question the claims and validity of data systems, including challenging the use of such data in education from an ethics perspective (Raffaghelli & Stewart, 2020)
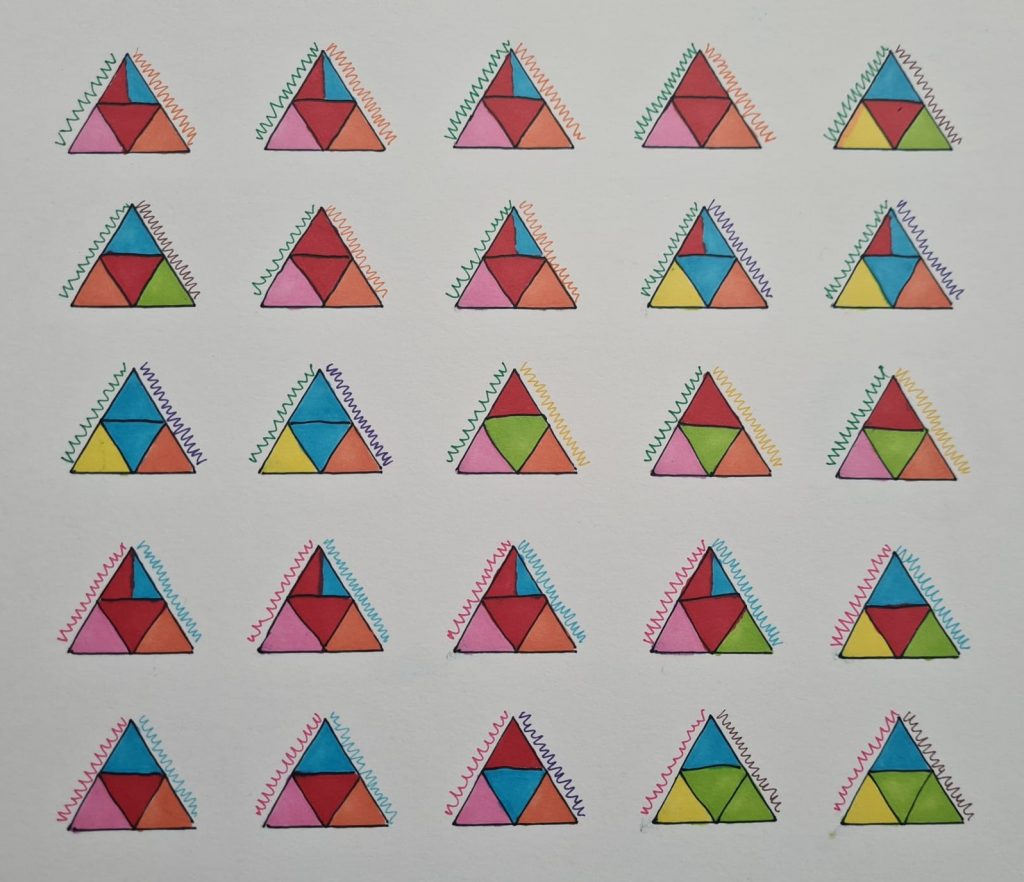
Much of this interrogation around data systems surrounded the concentration of the global data economy in major multinational tech companies. This raised issues of ‘Data Power’ and the exacerbation of inequalities in education through the use of digital services like dashboards that removed the human oversight element. For my second visualisation I explored the data that was stored from the pandemic on a learning management system, Schoolwise, that I used extensively throughout the Covid lockdown periods. The visualisation stemmed from the idea put forth that ‘Datafication leads to pedagogic reductionism when only the learning which can be ‘datified’ is seen as valuable’. (Williamson, Bayne & Shay, 2020).
Accountability
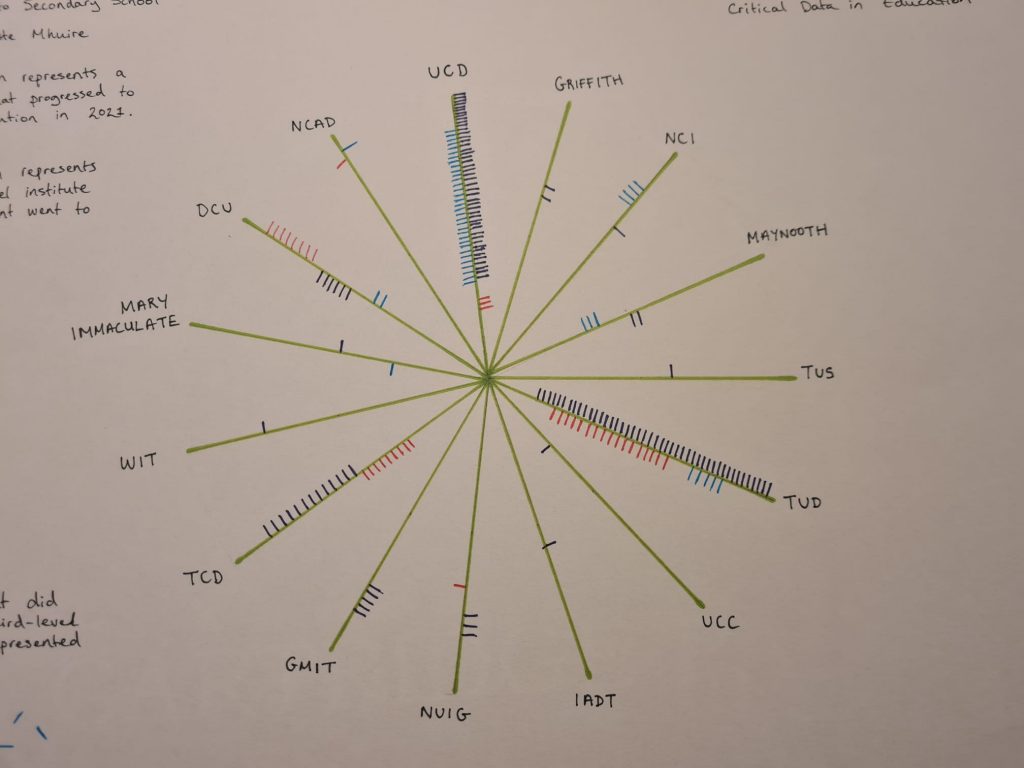
For my third visualisation, I examined the progression of students to third level education based on data distributed via The Irish Times school league tables. This visualisation allowed me to explore the theme of accountability through data. League tables positions parents and students as consumers in an ‘educational marketplace’ and autonomous free agents that are responsible for maximising their own educational attainment. Likewise, it places schools in a competitive marketplace as service providers who must vie for student and parental attention by demonstrating their effectiveness through data (Fontaine, 2016). It places pressure on me personally as a teacher to ensure that my students perform academically, achieving high grades in standardised testing such as the Leaving Certificate exams. The visualisation of three schools connected to me also highlighted the nature of data as a ‘social product’ as I was able to ‘take’ information and make judgements based on it as if I was a potential parent or student of one of these schools.
In conclusion
Overall, ‘Data visualisation’ as a task forced me to think about data in creative ways. What is not shown on the blog is how many initial attempts and pieces of roughwork ended up on the cutting room floor as I experimented and realised that certain ways of representing data would not be suitable for a particular data set (My third visualisation springs to mind….data sets with a wide range are not suited to linear scales but rather logarithmic ones) The hand drawn nature of the visualisations made it especially frustrating as I could not as easily restart or amend work as if it had been done with a digital visualisation tool such as Tableau or Google’s Charts. It did however, prompt me to be more considerate with how I approached each task and deduce in advcance what the best way to represent each data set was.
One of the key benefits of visualisation I noticed early on was its ability to make more apparent the patterns and trends in data sets that might get lost in numerical data alone. This was no doubt made more vivid by the change in colour palette from the whites, blacks and greys of Excel spreadsheets to the spectrum at my disposal in my pencil case of markers and pens. This definitely added a creative flare to the sometimes mundane process of blogging which made it more engaging and attractive to read.
I definitely feel like I will have more to discuss with my brother over the Christmas dinner table this year!
To sum up my thoughts at the end of the Critical Data in Education course, I am reminded of a quote from Stefanie Posavec when discussing the Dear Data project, ‘Data is the beginning of the story, not the end, and should be seen as a starting point for questioning and understanding the world around us instead of seeing it as the definitive answer to all of our questions’ (Lupi & Posavec, 2016)
Bibliography
Fontaine, C. 2016. The Myth of Accountability: How Data (Mis)Use is Reinforcing the Problems of Public Education, Data and Society Working Paper 08.08.2016
Lupi, Giorgia, Dear Data, ed. by Stephanie Posavec (London] UK: Particular Books, 2016)
Knox, J, Williamson, B & Bayne, S 2019, ‘Machine behaviourism: Future visions of “learnification” and “datafication” across humans and digital technologies‘, Learning, Media and Technology, 45(1), pp. 1-15.
Raffaghelli, J.E. & Stewart, B. 2020. Centering complexity in ‘educators’ data literacy’ to support future practices in faculty development: a systematic review of the literature, Teaching in Higher Education, 25:4, 435-455
Tsai, Y-S. Perrotta, C. & Gašević, D. 2020. Empowering learners with personalised learning approaches? Agency, equity and transparency in the context of learning analytics, Assessment & Evaluation in Higher Education, 45:4, 554-567,
Williamson, B “Conceptualising Digital Data,” in Big Data in Education: The Digital Future of Learning, Policy and Practice, by Ben Williamson (London: SAGE Publications, 2017)
Williamson, B. Bayne, S. Shay, S. 2020. The datafication of teaching in Higher Education: critical issues and perspectives. Teaching in Higher Education. 25(4), pp. 351-365.