
Visualisation of judgements
A key theme that stood out for me in the block readings related to accountability and the judgements that are made, collected, and used to measure success.
For my data visualisation I therefore decided to try to collect data on judgements, or considered measurements, that I made in one day. I recorded where I completed an action that involved a degree of consideration of information presented, or where tools were used to help determine an outcome.
As the data table shows I started out with three distinct categories, for the visualisation these fitted better grouped into two main types of ‘judgement’, ie qualitative and quantitative. The definitions I used to classify my judgements:
Quantitative – a value, discovered by measuring, that corresponds to the quantity, size, shape, etc.
Qualitative – a subjective assessment, estimation of the quality (value/worth) of something or someone.
I also chose to capture surrounding information on how the judgement was arrived at, to try to capture a bit of the consideration process to ensure the judgements were not just quick decision but were instead something I had arrived at having used tools or information to draw a conclusion from. I opted to record:
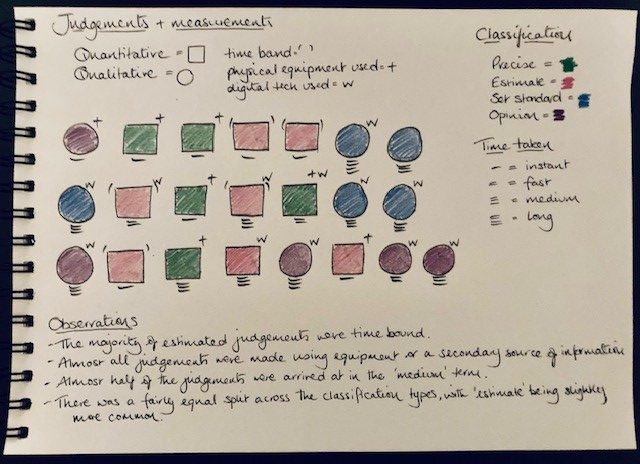
- The classification – to show whether the measurement or judgement was for example, precise or an estimation.
- Time bound – if the judgement related to a measurement of time.
- Any equipment used – either a physical measurement tool or reference materials to help inform my ‘judgement’.
- The time taken – to try to capture how quickly I arrived at the ‘judgement’.
This information was useful to help identify patterns or trends in the data collected; these are noted under ‘observations’ in my visualisation. As with previous visualisations I appreciate there could be issues with the ‘raw’ data, for example:
- the classification recorded was ‘precise’ – but this was only precise for my purposes. Had the measurement of, for example, water been required in a scientific experiment then a higher degree of accuracy may have been required.
- when considering the classification of ‘opinion’- I noted I was giving my opinion multiple times within the context of a large document. This was however only counted as one occasion or one judgement.
The question I kept coming back to when recording my data was, ‘would others agree with my measurements or judgements?’ For the quantitative measurements it could be argued that the use of a common agreed measurement (such as cm/inches etc) and a reliable measuring tape should result in two people agreeing the same outcome, but that is only true if there is clarity around what is being measured, what the agreed process would be, and how the measurement would be recorded.
The discourse around measuring school performance often sounds as though standard measurements are being made as standardised tests, or set criteria, are used on visiting government inspector reports etc, but how do we guarantee that these tools are being used effectively and consistently to provide accurate measurements which may then be used to inform judgements on school performance or even to inform policy on improvement programmes.
When we make inferences on schools’ performance or hold them accountable for the standard in the school can we be sure that the judgements being made are accurate? Have we got the tests right for measuring performance and are they being measured correctly? As Williamson (2017) highlights authority over education has seen a move away from centralised government and its agencies to instead include a wide range of other organisations and advisory bodies. This group of actors will likely bring with them a range of talents and knowledge; however, they also will have their own data collection methods, analysis, and interpretations and therefore potentially different ‘solutions’ to perceived issues or suggestions of future improvements (which may also happen to fit with the agencies own direction of travel). The increased prevalence of data being captured from digital education as Anagnostopoulos et al, (2013) describes has opened the opportunity for consultancies and computing firms to generate or expand their business as they assist districts or states as the reliance on data analysis and the testing process to generate the data becomes increasingly key to determining the success, or otherwise, of an institution. However, with more agencies involved is there a question over the reliability of the data collection and analysis process.
As Fontaine (2016) highlights accountability in education often starts with schools being held responsible for learner performance which does not take account of any of the socio-economic factors that could have contributed to outcome of the learner’s performance. With so much at stake for schools is it perhaps understandable why some schools may resort to teaching to the test to try to ensure that any measurement of performance results in their school reflect positively. As Williamson (2017) reflects this a move in educational institutions to focus on what can be ‘counted and accounted for’, which in turn prioritises activities that can be measured rather than activities which cannot be measured. The question here is what the long-term effect of that might be on the learners, and teachers, who are continually monitored on performance (counting results and outputs) rather than considering the much wider learning process which is a far more significantly complex process.
References
Anagnostopoulos, D., Rutledge, S.A. & Jacobsen, R. 2013. Introduction: Mapping the Information Infrastructure of Accountability. In, Anagnostopoulos, D., Rutledge, S.A. & Jacobsen, R. (Eds.) The Infrastructure of Accountability: Data use and the transformation of American education.
Fontaine, C. 2016. The Myth of Accountability: How Data (Mis)Use is Reinforcing the Problems of Public Education, Data and Society Working Paper 08.08.2016
Williamson, B. (2017) Digital Education Governance: political analytics, performativity and accountability. Chapter 4 in Big Data in Education: The digital future of learning, policy and practice. Sage.
This is fantastic Jillian, I really enjoyed your exploration of ‘judgements’! I think it fits this block well as so much emphasis is placed on transparency in order to assess the quality of judgements – particularly automated ones – that govern our lives.
You provided the data tables again which I appreciated as it enabled me to see how you’d regrouped information for your visualisation to better communicate what you considered important. Your data tables included definitions of the terms ‘judgement’, ‘qualitative’ and ‘quantitative’ which demonstrates your desire to really get at what you wanted to visualise.
Your visualisation was very clear even though it included indicators of time taken, a notion of ‘time boundedness’, precision level and whether judgements were arrived at using physical or technical elements. It really “worked” as a display as you were able to identify patterns and make some useful observations, and you extended this further by surfacing some potential judgements of your judgements!
What I found most insightful was that in spite of your distinct definitions of qualitative and quantitative, you commented that,
“The question I kept coming back to when recording my data was, ‘would others agree with my measurements or judgements?’ For the quantitative measurements it could be argued that the use of a common agreed measurement (such as cm/inches etc) and a reliable measuring tape should result in two people agreeing the same outcome, but that is only true if there is clarity around what is being measured, what the agreed process would be, and how the measurement would be recorded.”
I think this really gets at the blurred lines between quantitative calculations and qualitative judgement and it reminds me of Callon and Law’s (2005) article on “qualculation” in which the authors argues that qualitative judgement can’t be removed from calculative practice. You’ve applied these doubts about measuring ‘judgements’ to education and raised important questions about possible harmful effects. I thought this was a great piece of work, well done!
Callon, C. & Law, J. (2005) On Qualculation, Agency, and Otherness https://doi-org.ezproxy.is.ed.ac.uk/10.1068/d343t
Thanks Cathy, I really appreciate the feedback and your reflections on the post. Thank you also for the linked article. It has been a hard workday today with A LOT of discussion about the future of qualifications but with no real outcomes. The article therefore was timed perfectly for reading today. There is a lot to unpack in the article, it will take more than one read to truly get to grips with the concepts being discussed but I loved some of the ideas. There were quite a few points that stood out, and a few that made me smile as they were very eloquently describe, however the two points that stood out most were:
‘judgment is often distributed across time and geographical space. It flows, unfolds, and reflects local specificities. It cannot be drawn together at a single common-sense space and time.’ (Callon & Law 2005 p.720)
‘over entanglement in accountability produces the impossibility of qualculation.’ (Callon & Law 2005 p.728)
These points resonated with me following the discussions I was involved in today, as I mentioned earlier we were considering and discussing possible recommendations for the future of qualifications. These discussions ranged from short term immediate issues for specific subjects but also diverged into much wider discussions on curriculum and assessment longer term. Given the level of complexities or ‘entanglements’ that came up in discussion I appreciate now why no real final ‘conclusion’ could be reached, at least not one that fits all the variables or actors. Again, having some time to reflect on some of the discussions now I can also see that some viewpoints in the discussions today were likely to have been driven by perceptions on ‘accountability’. The train crash enquiry reference in the article was perhaps a sad point to reflect on but clearly illustrates the point of how accountability (either wishing to avoid or hold others accountable) can interfere with the ability to make judgements as additional links or entanglements are identified by the parties/actors involved resulting in an increasingly complex picture!
Some interesting food for thought. Thanks again for sparking my sleepy cells back into active and engaged mode! 😊
Callon, M., & Law, J. (2005). On Qualculation, Agency, and Otherness. Environment and Planning D: Society and Space, 23(5), 717–733. https://doi-org.ezproxy.is.ed.ac.uk/10.1068/d343t