
Block 2: Teaching with Data
‘Teaching with data’ is not necessarily a new phenomenon in education. Teachers have long used data gleamed through summative and formative assessments to make adjustments to their own practice, and inform their planning decisions in departments (Brown, 2020). This block explored how digital technologies and platforms have heavily altered the landscape of data collection and analysis in education to be far wider reaching by providing dashboards and displays of student learning and progress for teachers to access. It also examines the implications that this has for teachers and other educators who not only have to navigate this new territory often without the necessary digital skills, but who can also unintentionally find themselves on the receiving end of data-driven performance assessments.
Some key themes explored in this block that stood out for me include Data Literacy, Data power and Inequality.
Data Literacy
The datafication of education and its resultant new data systems has raised many questions about ‘digital literacy’, which refers to the competence of both educators and students to understand and make use of this data (Williamson, Bayne & Shay, 2020). Some argue that digital literacy can be can be viewed as a skillset which can be improved upon by equipping teachers with new techniques such as data handling skills. This ‘instrumentalist’ view of Data Literacy is challenged by Raffaghelli & Stewart who suggest that Data Literacy should instead incorporate a more critical approach that enables students as well as teachers to interrogate and question the claims and validity of data systems, including challenging the use of such data in education from an ethics perspective (Raffaghelli & Stewart, 2020)
Sander refers to this as ‘Critical Big Data Literacy’ and argues that the aim of this approach to Data Literacy is not to promote skepticism in internet users and leave them with a negative view on all data collection practices, but rather to foster user’s awareness and understanding in how their data is handled by third parties, which in turn enables them to critically contribute to debates on relevant issues and develop informed opinions about their own personal choices on what services to use and what data can be shared (Sanders, 2020).
Data Power
Much of the global data economy is concentrated in the ‘Big 5’ tech companies; Alphabet (Google), Apple, Microsoft, Amazon and Meta. Microsoft has long been invested in the education space through their popular learning management system Blackboard as well as their office software, and likewise many Google apps such as Gmail, Scholar and Classroom are staples in student’s digital education the world over. Likewise, Apple devices such as Laptops, smartphones and tablets are hugely popular among school students (van Dijck, Poell, & de Waal, 2018)
In recent years however, the big 5 have made a significant shift in their approach to the education market by developing online platforms that allow teachers, students and parents to access content production and distribution as well as learning analytics, performance metrics and administrative functions within sophisticated online portals or ‘platforms’. This shift has only been accelerated by the Covid-19 pandemic that forced many schools to close and shift to ‘remote learning’- a shift which was only made feasible by the existence of these new digital services.
Because very few institutions have the capital or technical infrastructure to compete with these major corporations possess, this results in a form of oligopoly where handful of companies control a vast amount of educational data. This imbues these institutions with a kind of ‘Data Power’ that allows them to control the debate on what constitutes a good student or teacher through their own data analytics (Williamson, Bayne & Shay, 2020).
The power of Platform Capitalism is increasingly being wielded in the Global South, where a new frontier of data driven colonialism is being used to exploit not territory and resources, but human beings through tracking of personal data which in turn in turn leads to discrimination and inequality.
Inequality
The reduction of education to data points has been proven to reinforce pre-existing issues of inequality.l ‘Algorithmic oversight’ or the removal of humans from the oversight of many processes can lead digital tools to automate inequalities and discriminate along gender and racial lines in a process known as ‘digital redlining’. (Williamson, et. al, 2020).
In the summer of 2020, Proctorio, a proctoring software in use by some UK universities was unable to identify a black student’s face in one notable instance as the data set its algorithm was not diverse enough to recognise a student of color
This ‘big brother’ level of smart surveillance brings with it a host of ethical issues while at the same time providing unprecedented opportunity for academia in the era of the smart university where data experts and computer scientists will play an increasingly important role in research. (Williamson, et. al, 2020).
Datafication leads to pedagogic reductionism when only the learning which can be ‘datified’ is seen as valuable. (Williamson, Bayne & Shay, 2020). Learning dashboards and platforms have a tendancy to over emphasise the kinds of data that are easily quaintifiable such as engagement and ‘risk of dropout’
This datafication has implications for teachers as well as students. Brown’s paper highlighted instances where data generated from one digital services showing low attendance could be taken out of context and used to inform data-driven decision making about his course. (Brown, 2020)
Data Visualisation

For my Data Visualisation for this block, I decided to focus on the different types of feedback I gave to my students.
For the same reason I chose to focus on ‘questions’ for my last visualisation, I feel that feedback is an appropriate subject for this weeks one as it is one of the aspects of teaching and learning that is not easily ‘datafied’.
Nonetheless, the source for my data came from the online education platform system we use in my school, Schoolwise.com. During Irelands second major Covid lockdown from January 2021 to March 2021 I used this platform every day to upload content for students, communicate with them and also to provide feedback for work completed both through assignments and live lessons hosted over Google Meets.
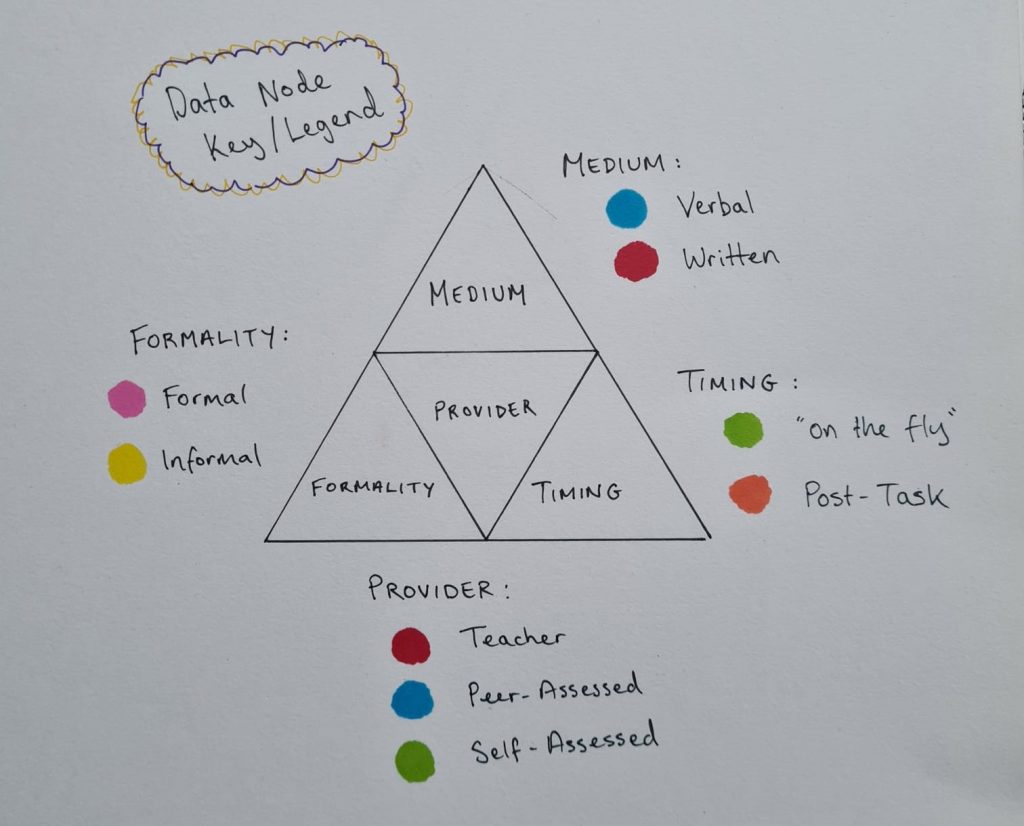
My Data visualisation represents 25 different pieces of feedback I provided to students during this period. On the platforms records of assignment uploads, I checked the feedback I had provided for each assignment and made notes on each one about the medium I used (Written or Verbal/Oral, or a mixture of both) the formality of it, did it come after a task or assignment was completed or was it more organic ‘in the moment’ and also took note of whether it was me providing the feedback or if we used peer/self assessment (enabled through commenting on work posted)
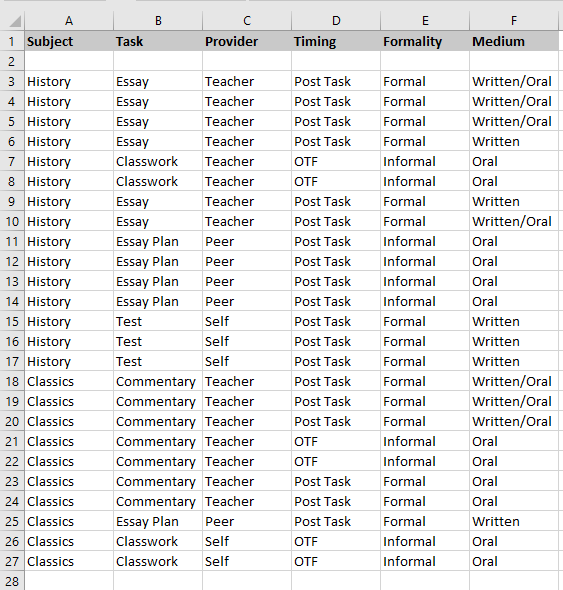
These key areas of feedback are visualised in the smaller triangles which make up each larger ‘Tri-Force’ (fans of the Legend of Zelda game franchise will understand this reference).
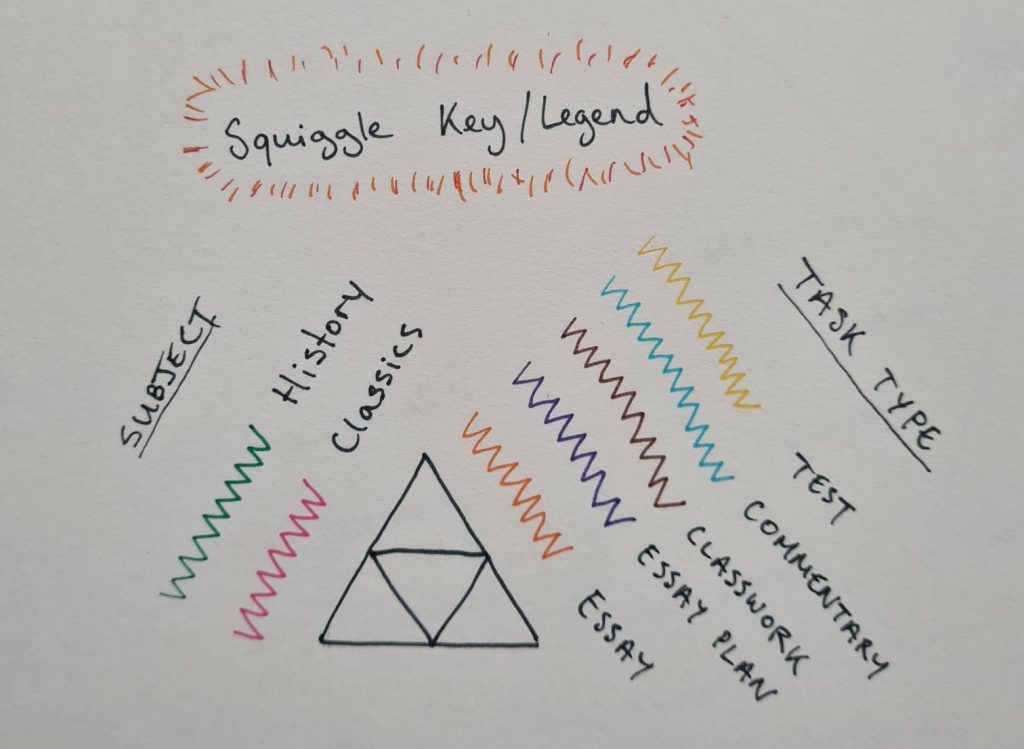
Elements that I saw as less central components (e.g. The subject in question, or task/assignment they were completing) are represented in the coloured squiggles on each side of the triangles.
Since schools have re-opened, I have engaged with the platform far less often. Nowadays I mostly use it for uploading content, or to cut down on printing. The majority of my feedback is provided in person via written and verbal comment.
However, the value of such platforms was undoubtedly cast in the spotlight for me during the pandemic and I struggle to think how teaching and learning might have coped without it, despite the little to no training we received to these new platforms. Even small differences like having the ability to record oral messages with a microphone and upload an mp3 file as feedback rather than provide a text message made a huge difference in feeling staying connected with students during such a difficult time.
The data collected from students allowed me to easily see who was not submitting assignments or attending live lessons, and phone home accordingly if I felt the student was disengaging with learning. Yet, none of that is to say that these are not things that I would have been keeping an eye on anyway if we were learning face to face.
However, the Covid era was a set of exceptional circumstances and as this block has highlighted, the proposed benefits of such platforms needs to be critically examined and ethical questions considered before we go running to them with open arms as we did during the pandemic.
Bibliography
Brown, M. 2020. Seeing students at scale: how faculty in large lecture courses act upon learning analytics dashboard data. Teaching in Higher Education. 25(4), pp. 384-400
Harrison, M.J., Davies, C., Bell, H., Goodley, C., Fox, S & Downing, B. 2020. (Un)teaching the ‘datafied student subject’: perspectives from an education-based masters in an English university, Teaching in Higher Education, 25:4, 401-417,
Raffaghelli, J.E. & Stewart, B. 2020. Centering complexity in ‘educators’ data literacy’ to support future practices in faculty development: a systematic review of the literature, Teaching in Higher Education, 25:4, 435-455
Sander, I. 2020. What is critical big data literacy and how can it be implemented? Internet Policy Review. 9(2)
van Dijck, J., Poell, T., & de Waal, M. 2018. Chapter 6: Education, In The Platform Society, Oxford University Press
Williamson, B. Bayne, S. Shay, S. 2020. The datafication of teaching in Higher Education: critical issues and perspectives. Teaching in Higher Education. 25(4), pp. 351-365.
One response to “Block 2: Teaching with Data”
This is a really thoughtful and eye-catching visualisation Mark. You’ve made a great decision to follow up the first block’s focus on questions by concentrating on answers for this ‘teaching with data’ block and used your own experience to situate your thinking. You’ve engaged with the literature really thoroughly and I like the way that you’ve taken three themes and explored them across all the readings.
You comment that information on feedback is not easily datafied, so I wonder whether the visualisation tells you what you would like to know? Were you restricted by the data Schoolwise recorded and what you could remember of each interaction? Your visualisation displays information about the feedback provided but the system hasn’t married that up with students’ ongoing performance. Would Schoolwise provide more useful data if it “fed forward” and correlated feedback with numbers of marks? Bulger (2016) comments that “it is difficult to measure for or optimize for success when success isn’t clearly defined. For schools, if the end goal is unclear, it is difficult to evaluate what elements of the learning experience are contributing to reaching broader goals.” (p.19). Bulger is talking about the wider goals education of here, but it would be interesting to know if your own judgement about feedback would be supported by a record of “inputs and outputs” generated automatically.