
A key theme explored in this block was that of ‘accountability’ – the process by which students, educators, schools and other administrators record their progress. Accountability in education has widespread implications for policy and decision making at a national, district and intra-school level by allowing stakeholders to examine and compare key performance metrics of schools.
The focus of my third Data Visualisation for the ‘Governing with Data’ block is the performance of three schools I have taught in during my career based on the data available in the Irish Times newspaper ‘feeder schools league table’ for 2021.
The existence of league tables to rank schools remains a sensitive issue in education. Northern Ireland and Wales have abolished them, while Scotland historically has not had any. They are more common in England where media outlets such as the Times publish annual tables based on data made publicly available by the Department for Education (See the Times 2022 league tables published 9th December here).
The feeder schools league table is published annually by the Irish Times and ranks secondary schools in Ireland based on the progression of their Leaving Certificate student’s (Ireland’s terminal examination which takes place at the end of students final year) progression to colleges on the island of Ireland. This data is made publicly available by Ireland’s Department of Education at the end of each calendar year and the Irish Times has traditionally published its League tables based on this data in January of the following year.
League tables for schools in Ireland have proven to be a controversial topic, with many bodies such as the teaching unions ASTI and TUI condemning them for the reductive and performative view of education it promotes as a result of the limited data set they are based on. Others have rationalised the publishing of the tables for alternative reasons, such as facilitating parents choice of which schools to send their children to, school accountability and to allow schools to use the performance indicators contained within for their own benchmarking purposes.
Fontaine (2016) explores the myth of accountability and argues that it positions parents and students as consumers in an ‘educational marketplace’ and autonomous free agents that are responsible for maximising their own educational attainment. Likewise, it places schools in a competitive marketplace as service providers who must vie for student and parental attention by demonstrating their effectiveness through data.
League tables when used as an indicator of a schools performance places pressure on teachers as well as schools. Teachers face pressure to ensure that their students perform academically, achieving high grades in standardised testing such as the Leaving Certificate exams and A-Levels. Schools are incentivised to accept students that are more academically talented while overlooking those who possess less academic abilities such as sports and artistic endeavours.
This is glaringly evident in the case of the Irish Times league table’s data, whose sole metric is ‘Progression to third level institutes’. Students that take alternative career paths post-secondary education are silent in the data. There is no recognition of students that enter employment, begin apprenticeships, choose to take a ‘gap year’, travel, work in agricultural or enrol in dance or art colleges. By focusing on progression to third level alone, there is a strong bias towards students from more affluent backgrounds for whom progression to University courses is the more traditional educational path after secondary school. Likewise, there is no acknowledgement of the socio-economic backgrounds that each school has to operate in, nor do they take in to account the progress that students may make while in school. Some inspectorates such as Ofsted in the UK provide for this shortcoming in the data by arguing that these contextual factors should already be reflected in the prior attainment of pupils (Ozga, J. 2016). Anagnostopoulos, Rutledge & Jacobsen (2013) refer to this focus on terminal examination results as ‘test-based accountability’ and argues that while accountability of public institutions is generally supported by the public, such assessments can only provide a narrow view of the quality of schools, teachers and student learning.
Standardisation of curriculum and assessment has been a feature of public education since its inception, and the rise of large scale information systems has only intensified this standardisation (Anagnostopolous et. Al, 2013) Through test-based accountability, government policy makers extend their reach in to local districts and schools and promote a culture among educators of ‘teaching the test’, whereby educational processes and pedagogical methods are geared towards achieving high marks in terminal assessments, often at the expense of other extra-curricular aspects of schooling. Data collection on student performance also indirectly allows for the monitoring of teachers performances as well, and this data can be used at a school level to inform decisions on the hiring and firing of teachers, reconstitutions of leadership and in some cases school closures (Fontaine, 2016) .
However, evaluation of school performance is not restricted to quantifiable metrics such as exam results alone. In the UK, the Office for Standards in Education (Ofsted) has produced its own digital dashboard called SDD (School Data Dashboard) through which educational stakeholders can access a data-led alternative to the conventional school inspection report (Williamson, 2017). Because of the inspectorates unique position as directly observable of sites and practices, they function as expert qualitive judges of teaching and learning while also positioning themselves as the mediators or ‘translators’ of this information (Ozga, J. 2016)
For my visualisation, I attempted to reflect these issues by taking the performance of three schools I have worked in that cover a broad range of educational contexts.
Colaiste Mhuire, the school I teach in currently is a mixed, Irish-language school in a disadvantaged area on the Northside of Dublin. It has DEIS status (Delivering Equality of Opportunity in Schools), a marker of educational disadvantage that affords the school a number of extra supports.
St. Benildus College is an all-boys public school in a middle-class suburb on the southside of Dublin.
Loreto Secondary School is an all-girls, fee paying school in the affluent suburb of Foxrock in South Dublin.
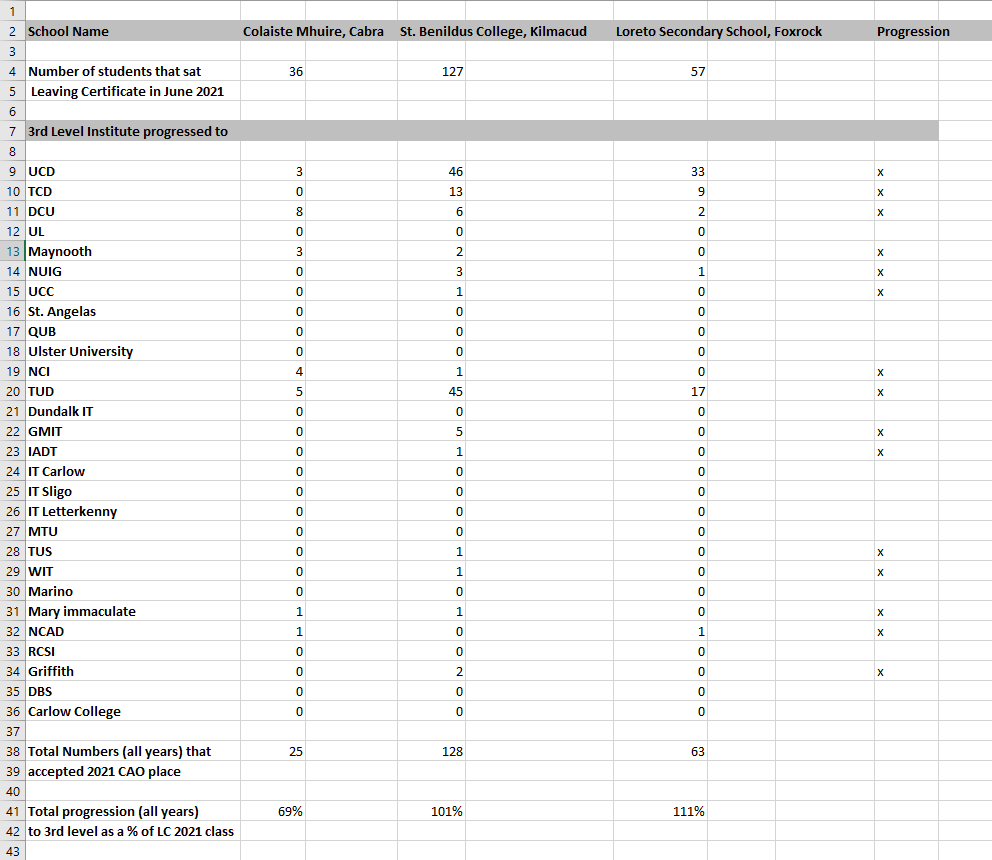
The data was taken from the most recent Irish Times feeder schools league tables published on January 7th 2022, available here.
The shortcomings of the Irish league tables as a measure of success are apparent in the bare picture it paints – listing only the names of 15 third-level institutions that students progressed to that year.
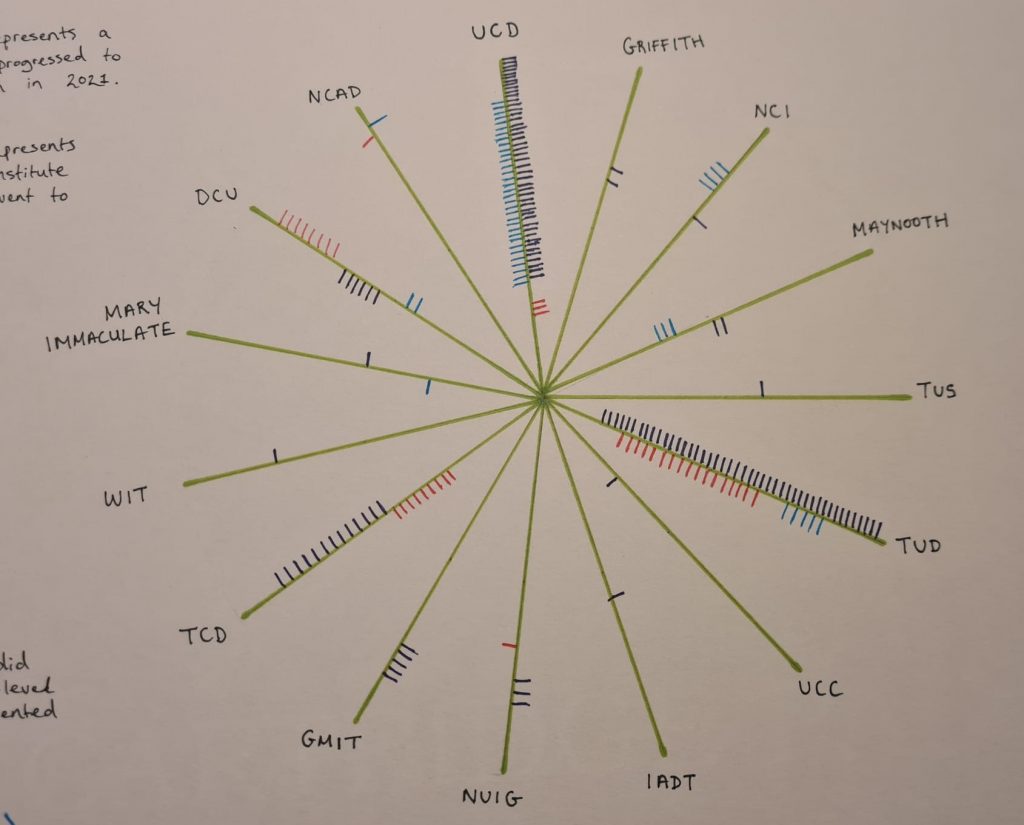
I opted for a ‘tree’ style diagram to represent the students that progressed to third level, with a branch for each of the 15 institutions that the students from the three schools progressed to.
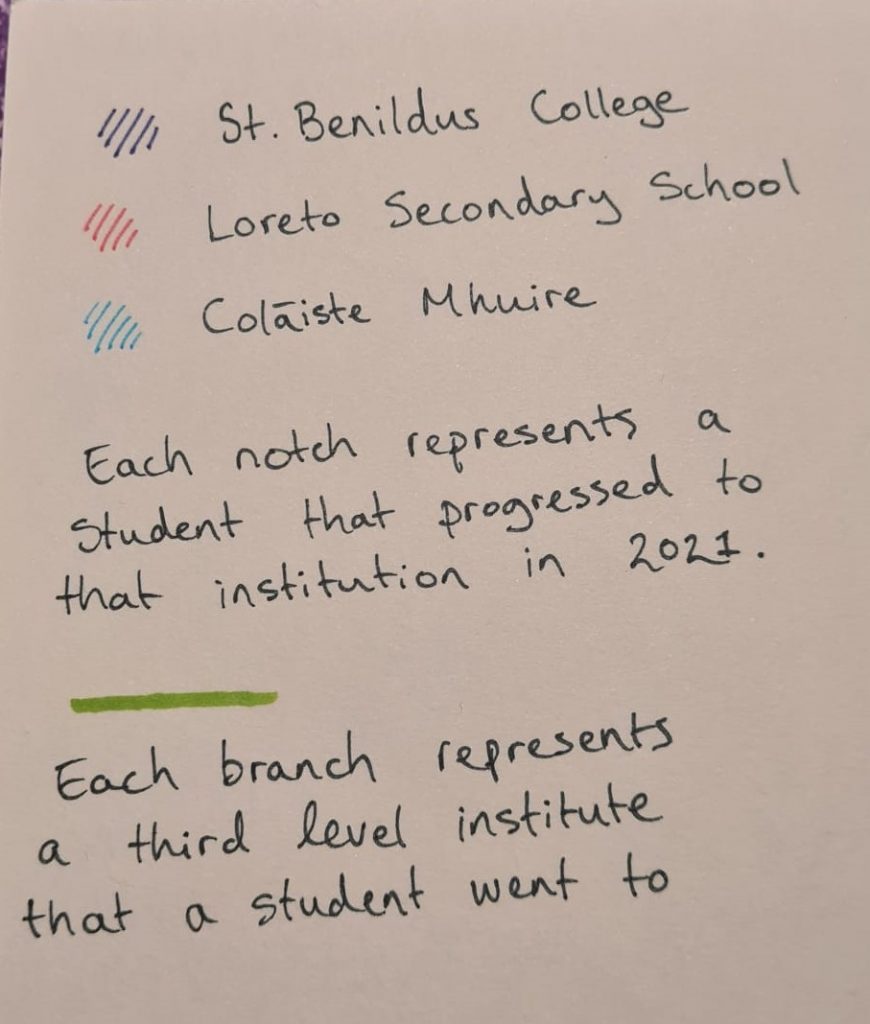
Each branch contains a number of coloured notches or ‘leaves’, with one leaf representing one student (colour coded for each school)
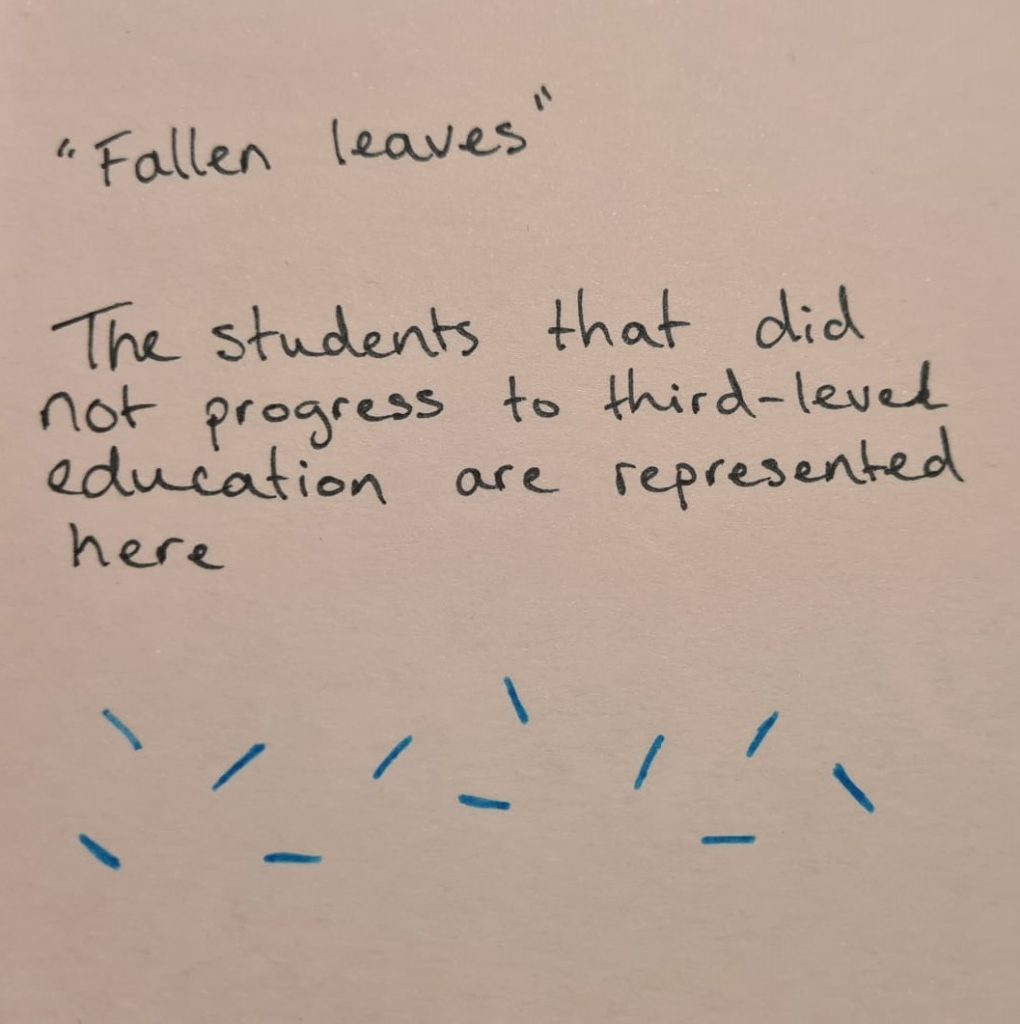
I attempted to include the ‘forgotten’ students as fallen leaves at the bottom of the tree to show that they are not represented in the data. I did not have any data available on what these students progressed to after leaving school, only that they did not attend any third level institutions accounted for in the league table.
Bibliography
Anagnostopoulos, D., Rutledge, S.A. & Jacobsen, R. 2013. Introduction: Mapping the Information Infrastructure of Accountability. In, Anagnostopoulos, D., Rutledge, S.A. & Jacobsen, R. (Eds.) The Infrastructure of Accountability: Data use and the transformation of American education.
Anagnostopoulos, D., Rutledge, S.A. & Jacobsen, R. 2013. Conclusion: The Infrastructure of Accountability: Tensions, Implications and Concluding Thoughts. In, Anagnostopoulos, D., Rutledge, S.A. & Jacobsen, R. (Eds) The Infrastructure of Accountability: Data use and the transformation of American education.
Fontaine, C. 2016. The Myth of Accountability: How Data (Mis)Use is Reinforcing the Problems of Public Education, Data and Society Working Paper 08.08.2016.
Ozga, J. 2016. Trust in numbers? Digital Education Governance and the inspection process. European Educational Research Journal, 15(1) pp.69-81
Prinsloo, P. 2020. Data frontiers and frontiers of power in (higher) education: a view of/from the Global South. Teaching in Higher Education, 25(4) pp.366-383
Vani K. Borooaha*, Donal Dineenband Nicola Lynch (2010). Which are the ‘best’ feeder schools in Ireland? Analysing school performance using student third level destination data. Irish Educational Studies. Vol. 29, No. 2, 107-130
Williamson, B. Digital Education Governance: political analytics, performativity and accountability. Chapter 4 in Big Data in Education: The digital future of learning, policy and practice. Sage.
The Irish Times – Feeder Schools Tables, 2021. Published 7th Jan 2022. Accessed at: https://www.irishtimes.com/polopoly_fs/1.4770894.1641538061!/menu/standard/file/feederSchools-Jan.pdf