Critical Data in Education – A Reflection
Introduction
‘At first glance data are apparently before the fact: they are the starting point for what we know, who we are, and how we communicate. This shared sense of starting with data often leads to an unnoticed assumption that data are transparent, that information is self-evident, the fundamental stuff of truth itself. If we’re not careful, in other words, our zeal for more and more data can become a faith in their neutrality and autonomy, their objectivity.’
(Gitelman and Jackson, 2013, pgs. 2-3)
The quote above, and the subsequent conversations in our first virtual meeting, opened up my perspectives on data. The idea that ‘“Raw Data” Is an Oxymoron‘ (2013), was something I hadn’t previously considered as an educator. I, rather naively, had sometimes viewed raw data as an element of truth. Therefore, it was important for me to use this blog, and experience, to explore my relationship with data through learning, teaching and governance.
Learning with Data
During this block, the literature review focused heavily on personalised learning and the implications for teachers and their students regarding learning analytics. The discourse surrounding student agency and ethics highlights the need for open and transparent systems (Tsai et al., 2020). In addition, we must continue exploring the practicalities of personalised learning to meet the student and teacher’s needs (Bulger, 2016).
The goal of this block’s data visualisation was to explore my relationship with data in the context of my job. What might that relationship look like, and how might student agency, ethics, and learning analytics play a role?
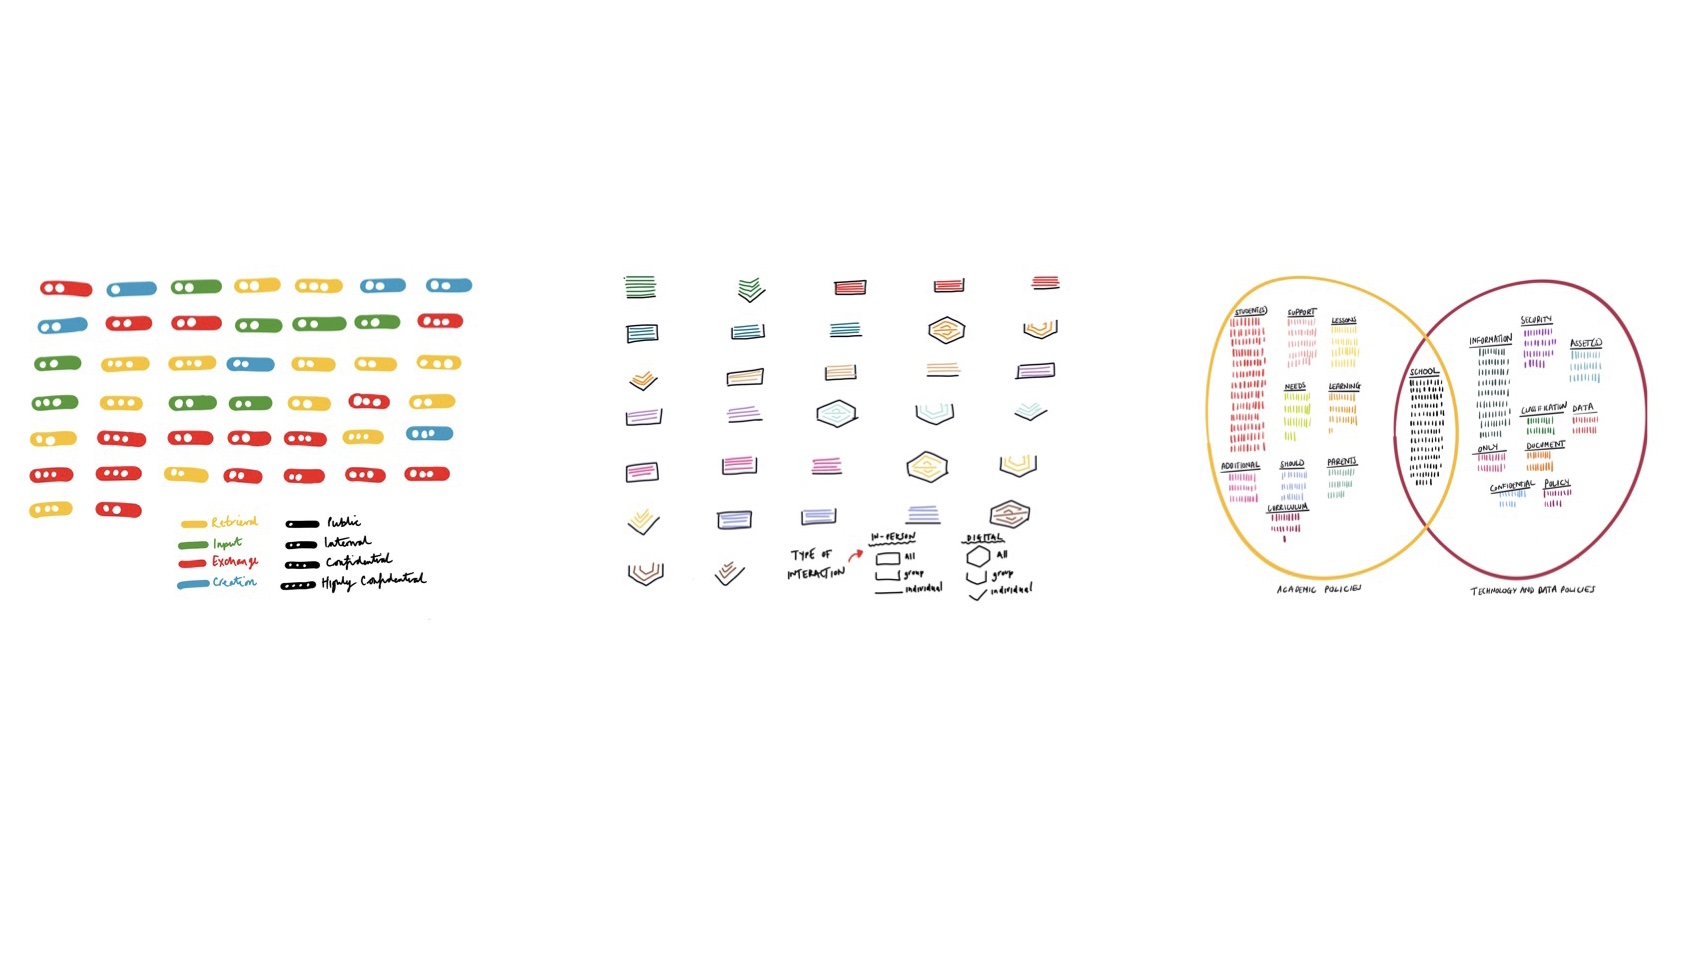
The final visualisation was created by documenting my interaction with IT systems at work. I took my so-called ‘raw data’ to convey a specific narrative, keeping some information hidden for clarity. The process made me reflect on how one decides whether data is reductive or productive. I chose not to share the names of the specific systems I used, focusing purely on the type of interaction I had and how confidential that data was. In the context of this exercise, it is not an issue. However, it highlighted how easy it is to cherry-pick data to sell a narrative. What are the implications of this on a larger scale? The need for transparency is essential to build trust. How damaging could it be for students (and teachers) if data narratives do not paint an accurate and fair picture?
Teaching with Data
In the second block, we looked closely at datafication and the potential for technology, like live data dashboards, to disrupt the classroom. Images of students with electronic headbands and sensors attached to their bodies only added to the dystopian rhetoric of data assimilation. As a teacher, I can not imagine a school leader who would willingly put their students through this all for the sake of ‘progress’. I also worry that our youngest students have little to no say on how and when their learning data is captured and how others may use it. This concern also reaches higher education as,
‘It also raises questions about trust in students, as students are increasingly viewed as ‘transmitters’ of data than can be sensed from autonomic signals emitted from the body, rather than as sense-making actors who might be engaged in dialogue.’ (Williamson et al., 2020, pg 361).
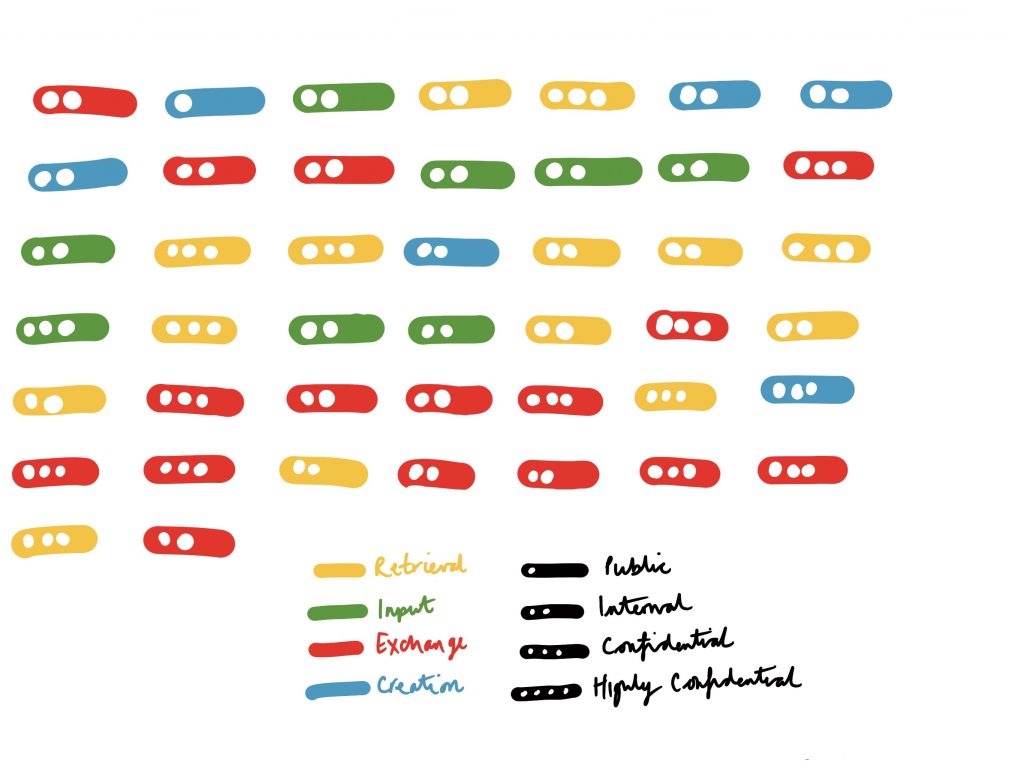
As I continued exploring my relationship with data for the visualisation task, I decided to consider my interactions with students (rather than with IT systems in the previous block). Do I create or engage with my students enough through digital means for datification to impact my practice?
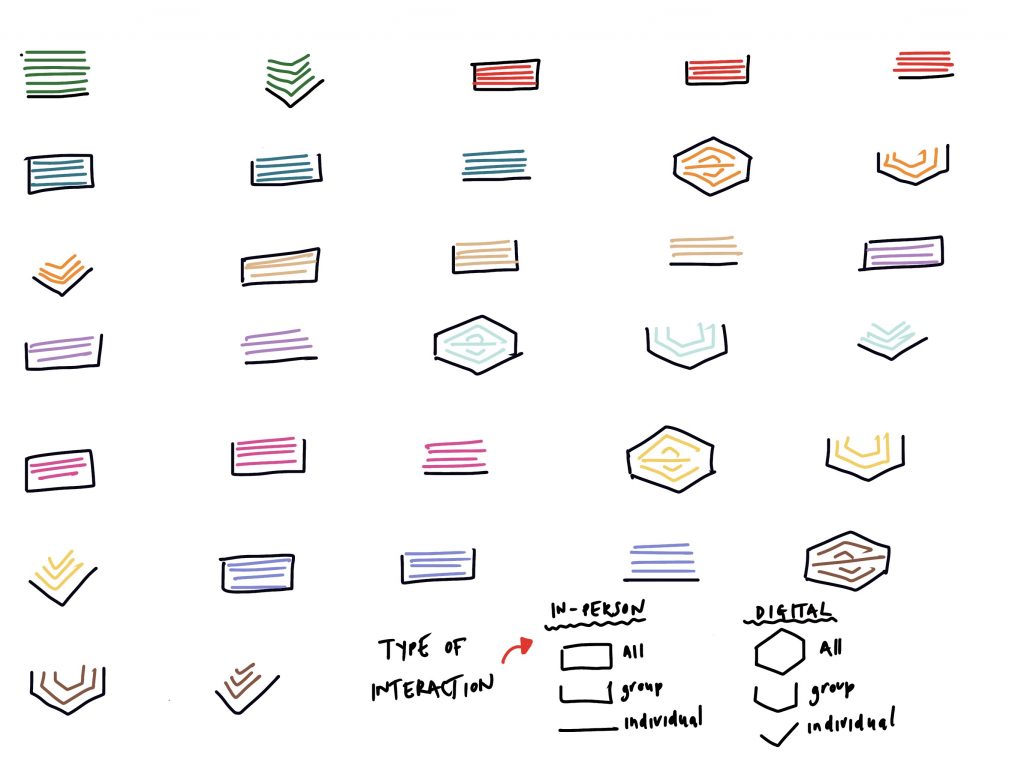
I observed that most of my interactions with my students were in-person, interacting in real-time rather than through digital means. Therefore, for technology like live data dashboards to influence my practice, a significant amount of data harvesting would have to occur. I deliberately use the word harvesting, as such technology would have to record such interactions, analyse them and present them in a way that informs me or influences my teaching. My biggest question to this is, why? Why would I allow this technology to replace the job I have spent many years crafting, refining and reviewing? The ethical implications here are huge. Not only that, but we have to consider the intent of those companies that develop such tools. What power and influence might they have, especially as schools become more desperate to show they are making progress or worthy of particular forms of funding? What impact do data collection and use have on policymaking?
Governing with data
As we discovered in the final block, said companies appear to exert more influence and power over policymaking at individual school and government levels (Williamson, 2017). Furthermore, fast policy, ‘refers to the increasing porosity between policymaking locales; the transnationalization of policy discourses and communities; global deference to models of ‘what works’ and ‘best practices’’ (Williamson, 2017, pg. 107). Schools are sold on the promise that new technologies, particularly ones exemplifying dataficiation, will offer quick and easy solutions. With Covid hanging over our heads, there has been a depressing need to find quick fixes that solve our educational woes.
In my final visualisation, I looked at policies at my current institution. By comparing academic policies to technology and data policies, I was interested in the comparison. Therefore, I recorded and analysed the frequency of words used in various policies to paint the picture below.
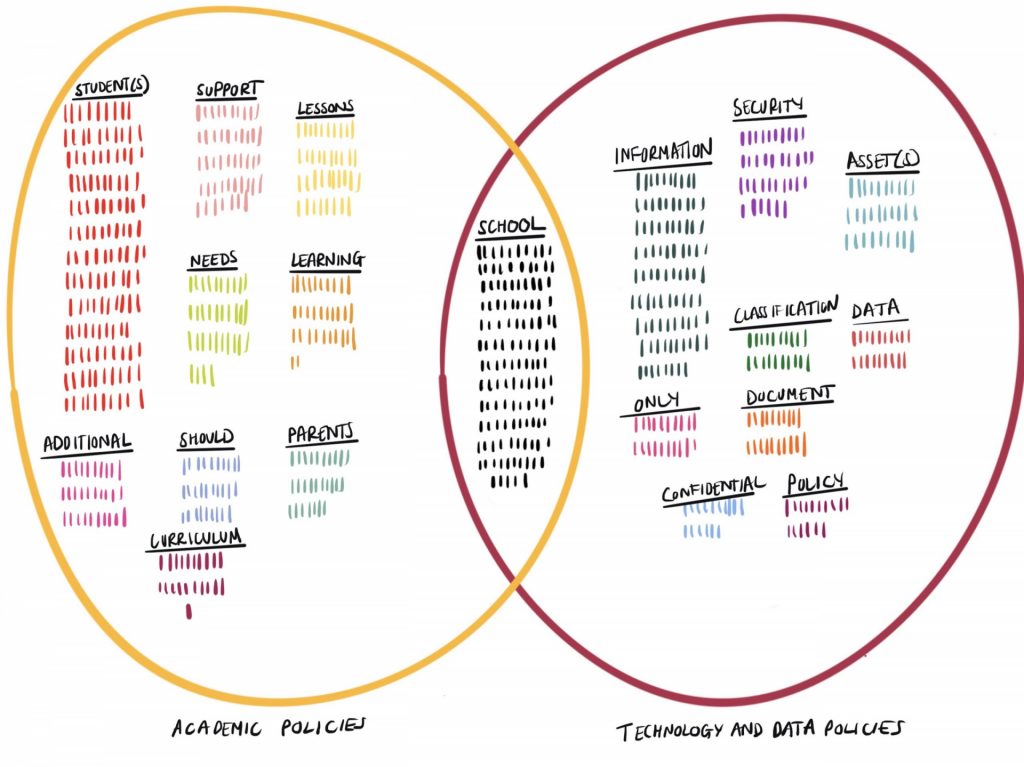
The contrast in the language used only helped exemplify the disconnect between the human aspects of education and its technical components.
Final Reflection
Before starting this course, I admit that I had an aversion to data! The topic of data, especially in school, is often very dull and often tells us very little about the learner as a whole person. Lupi and Posavec’s (2016) Dear Data was an inspiring start! I had never thought about presenting data in such different ways. The process of blogging and thinking of new creative, and exciting ways to present my visualisation has kept me engaged. Most importantly, the course has succeeded in opening my critical eye to data and its ongoing place in education.
Bulger, M. (2016). Personalised Learning: The Conversations We’re Not Having. Data & Society working paper. Available: https://datasociety.net/pubs/ecl/PersonalizedLearning_primer_2016.pdf
Gitelman, L. and Jackson, V. (2013) Introduction. Chapter 1 in “Raw Data” is an Oxymoron. The MIT Press.
Lupi, G. and Posavec, S. (2016). Dear Data. Particular Books.
Tsai, Y-S. Perrotta, C. & Gašević, D. (2020). Empowering learners with personalised learning approaches? Agency, equity and transparency in the context of learning analytics, Assessment & Evaluation in Higher Education, 45:4, 554-567, DOI: 10.1080/02602938.2019.1676396
Williamson, B. (2017) Digital Education Governance: political analytics, performativity and accountability. Chapter 4 in Big Data in Education: The digital future of learning, policy and practice. Sage.
Williamson, B., Bayne, S. & Shay, S. (2020). The datafication of teaching in Higher Education: critical issues and perspectives. Teaching in Higher Education. 25(4), pp. 351-365.