
Data collection and visualisation
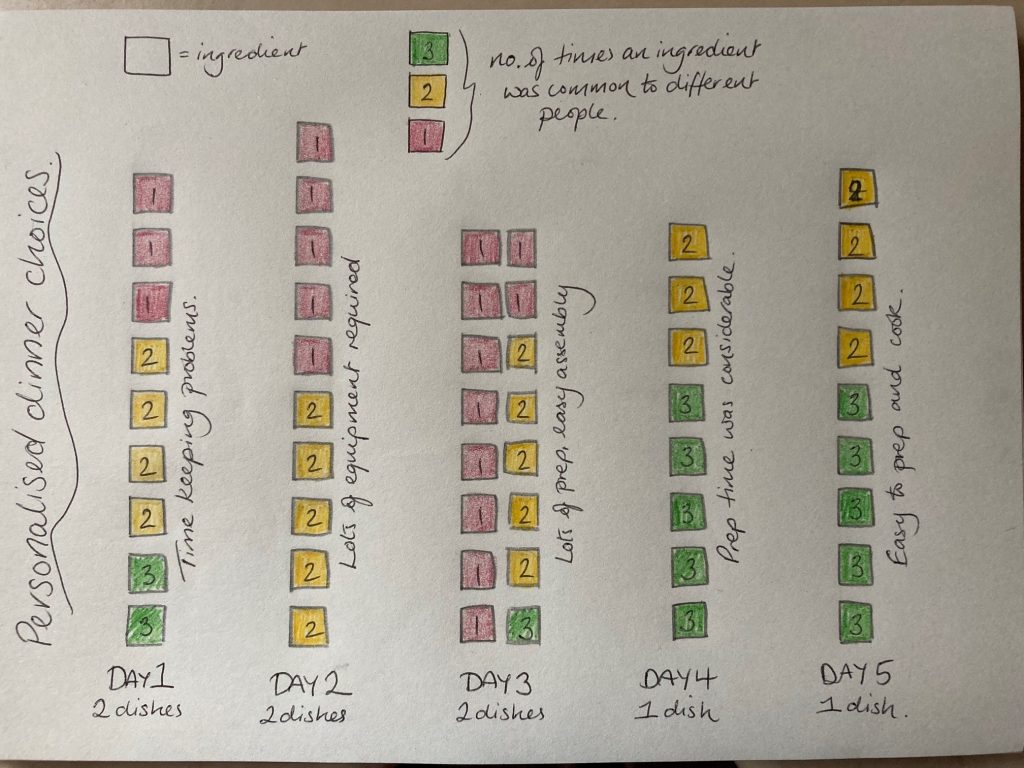
For my data visualisation I wanted to use the theme of personalisation as a follow on from my earlier blog post. While I was considering this I was in the kitchen preparing dinner, not just one dinner but a set of dinners with much personalisation involved, so I started noting down dinner choices and the ingredients and continued to do so for the next 5 days.
Choosing a food theme for my data collection made me reflect on the exercise we did on the IDEL course where we considered metaphors for learning, for that task I also chose a cooking theme. The idea being that if the output of the cooking (or learning) process is a completed dish then the actors could be the ingredients, the recipe, the equipment, time, and the skill of the cook etc. Varying any one aspect to give it more agency than the other produce quite different results.
My initial attempts at collecting data were messy as there was variations of how best to record the data. To help organise the information better I transferred my notes into Excel. Having more organised data enabled patterns to be seen in the data which could then be presented in a visual form.
When considering some of the observations relating to the data I was aware that there was some relevance to comparing the at home dinner personalisation to the broader area of personalised /student-centred learning.
| Observation | Edtech/Personalisation learning comparison |
| Small tasks which were quick to complete meant timing of the tasks was crucial to avoid everything needing attention at the same time. | Individuals completing a series of short tasks may finish at different times. Learners could move through set steps at a pace that suits them. This could cause extra work for the teacher to monitor individual learning platform feedback as everyone may be at a different stage. |
| Sometimes the level of ingredients was low, but the time taken for prep, or the volume of equipment was high, so the data obscured the fact that it was a lengthy or complex processes. | Individuals have different needs in terms of their learning, accommodating to different requirements can be complex for teachers. Learning platforms can tailor or provide options for learners to navigate them to an appropriate area/level of study. This may require a degree of candidate self-direction and self-motivation. Learning platform developers need to have sufficient expertise (or work with experts) in the subject area and pedagogy to create meaningful online access to learning. |
| Finding a balance between meeting everyone’s preferences whilst trying to avoid lengthy prep time and large volumes of equipment was not always easy to achieve. The easiest way to do this was to create a main dish (eg pasta) then let everyone add their own extra topping or side dish | If core curriculum, at an appropriate level of demand, forms the basis of the learning content to be cascaded then additional information/tasks can be built around this to address the issues of learners who work at a faster/slower pace or higher/lower level of difficulty.Large volumes of content can be interpreted as being ‘value for money’ or ‘quality’ products. Having wide content areas could be beneficial to learners but only if it is appropriate in terms of level of demand and content relevance. |
Undertaking this task, and the earlier task shared on the forum, did help me appreciate how subjective the data collection process can be, which obviously has an impact on the analysis and visual presentation. There are many other areas I could have extended the data collection into, equipment, reasons for choice, outcome, and preference, but I was conscious that some of those areas could potentially be even more subjective as they could involve collecting opinions rather than facts, so the ‘raw’ data becomes potentially less reliable. Keeping it simple meant more reliable outputs, which is something I would now like to try to practice in the kitchen too
I really loved your use of metaphor, Jillian, and the call back to IDEL. I really relate to the idea of subjective data collection and the overall influence it has on final output. I also appreciated how you linked this particularly personal experience to the theme of the block and to the wider reading. This is something I’ll personally take forward into block 2.
Thanks Craig, there have been so many good themes to explore in this first block, and first readings, that it was hard to decide where to focus, especially when trying to keep Blog word counts reasonable! It seemed appropriate to go for something that resonated personally (pardon the personalisation pun) as it does help to try to make sense of some of the bigger concepts at play when considering a small area that I am familiar with.
You’ve set out some really thoughtful alignments of personalised learning with the customised meals you’ve prepared for experimenting with visualisations this week. I like the productive way you’ve thought about obtaining ordered data from “messy” meal preparation in a busy household and how you used Excel to help as the software dedicated to counting and accounting. Providing access to your underlying data tables was a nice touch as so often the “hard data” behind systems and visualisations is not available.
“If core curriculum, at an appropriate level of demand, forms the basis of the learning content to be cascaded then additional information/tasks can be built around this to address the issues of learners who work at a faster/slower pace or higher/lower level of difficulty.”
This is quite possibly the approach taken by many ‘personalized’ learning systems that offer extra material to some learners and remedial exercises for others. It seems significant that you link this to cost/investment as commercial systems will find benefit in supplying core content and less return, perhaps, on extended content.
Thanks Cathy, I like the ‘messy’ reference as it captures various parts of the process! I was only dealing with small numbers over a few days but it was enough data to warrant a more systematic recording system that the notes that I had jotted down over the period of recording. At work I do deal with larger volumes of data (on occasion) but I can’t quite comprehend the volumes of data that can be collected and sorted for analysis to prove or disprove whatever hypothesis that is being worked on. Having done some more reading since doing this task I love the description that Kitchin (2014 – Big Data, new epistemologies and paradigm shifts) gives of big data as I think this does capture the complexity (or messiness) or big data and its possible power.