Teaching with Data – GoodReads and Instagram Platformisation visualisation
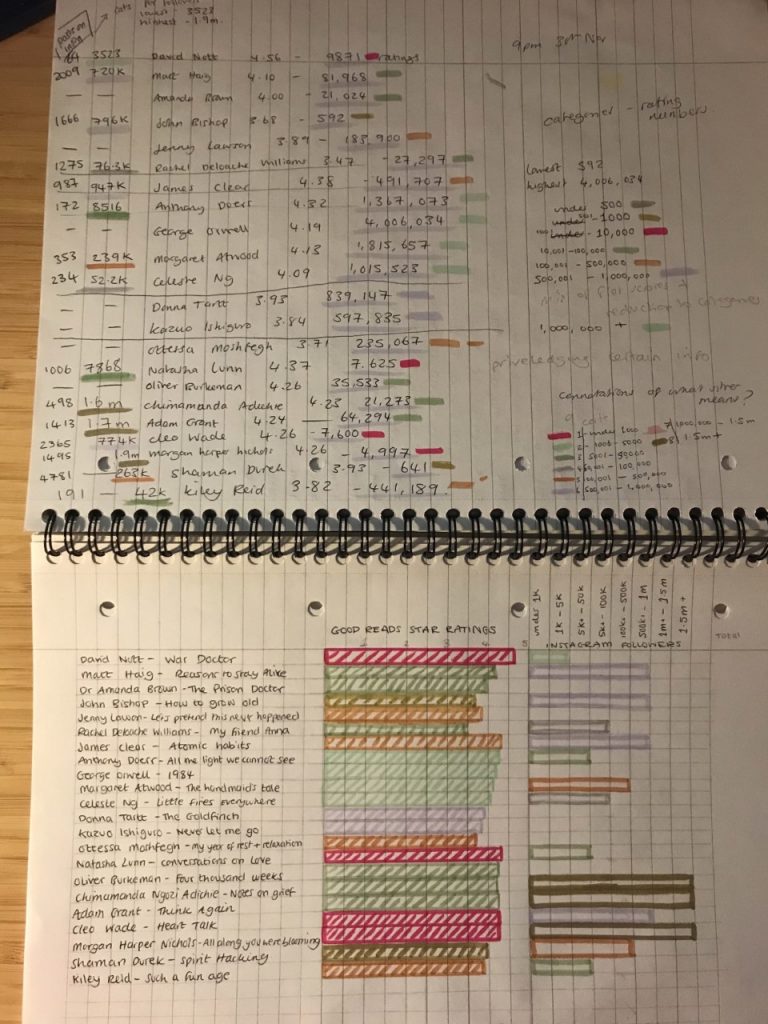
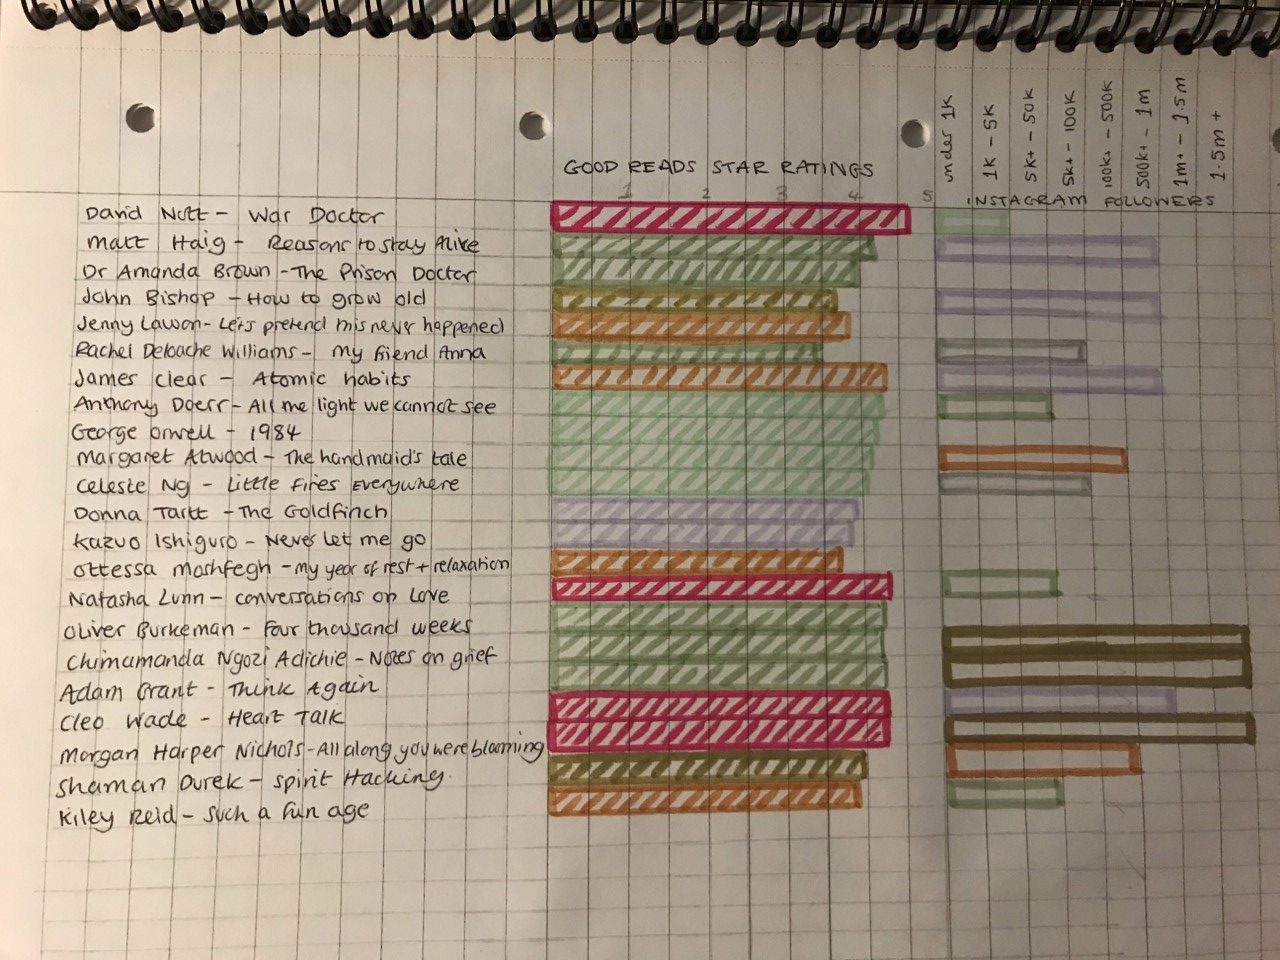
I based my ‘Teaching with Data’ visualisation on platformisation. I collected goodreads data of the books recommended to me, their star ratings and categorised them by how many times they had been rated. For the second element, authors Instagram followers were plotted against the recommendations in two bar chart-style visualisations.
I wanted my visualisation to comment on the platforms ecosystem and represent how it has become necessary to have data literacy skills in teaching to examine independent factors and derive meaning. Van Dijck et al (2018) discuss how the technological architecture of platforms ‘directly informs its pedagogical philosophy of personalized data tracking’ (van Dijck et al, 2018) meaning that data is created through pre-existing structures, contributing to the notion that ‘platformization ignores basic principles such as academic autonomy and independence’ (van Dijck et al, 2018). My visualisation gives a limited choice of books (limited autonomy) and its structure privileges data that is most easily tracked i.e., the quantitative ratings. This mirrors the prescriptive way performance in the form of assessment scores is used as a success indicator of “good teaching”; influencing the information that is privileged in teaching and overlooking anything that isn’t as easily recognised by a dashboard platform.
Akin to teaching with data, the qualitative, complex and personal information of whether the resource has been meaningful is unavailable. There is little way of knowing if the data recorded is deliberate or accurately represents knowledge built.
The implied aim of goodreads to evoking the practice of reading rather than tracking knowledge built, which could be argued as similar to the phenomenon of teaching increasingly being seen as a role of facilitation. The assumption of meaning also extends to a lack of data: in my visualisation a few of the authors do not have Instagram and the gaps feed into the risk datafication carries of ‘pedagogic reductionism as only that learning that can be datafied is considered valuable’ (Williamson et al, 2020, P358).
To represent whether the book holds knowledge considered useful to wider society, my visualisation places Instagram followers as a proxy metric for societal impact, omitting nuance as to why or who values those voices related to what is being taught (or recommended in the case of goodreads). This notion of value to society is highly applicable to ‘Bildung’, (van Dijck et al, 2018) as education to enhance the common good. This questions how platforms such as goodreads enact their values and how this influences the recommendation process. The profit-based nature of technology development appears in juxtaposition of this but prevails as part of the socio-technical assemblage involved in teaching with data. The reliance and commodification of data in education is discussed by Williamson et al (2020) as ‘dataism’: routed in the neoliberalist focus on marketisation and performance measurement.
In summary, my visualisation requires interpretation in relation to contextual factors, despite being presented as unambiguous. Space must be preserved to consider elements which are concealed or omitted from the visualisation due to the platform structure or societal values.
References
Brown, M. 2020. Seeing students at scale: how faculty in large lecture courses act upon learning analytics dashboard data. Teaching in Higher Education. 25(4), pp. 384-400
Raffaghelli, J.E. & Stewart, B. 2020. Centering complexity in ‘educators’ data literacy’ to support future practices in faculty development: a systematic review of the literature, Teaching in Higher Education, 25:4, 435-455, DOI: 10.1080/13562517.2019.1696301
van Dijck, J., Poell, T., & de Waal, M. 2018. Chapter 6: Education, In The Platform Society, Oxford University Press
Williamson, B. Bayne, S. Shay, S. 2020. The datafication of teaching in Higher Education: critical issues and perspectives. Teaching in Higher Education. 25(4), pp. 351-365.
Terrific visualization Becky. Your commentary offers a really powerful example of how authoritative and ‘unambiguous’ quantitative data can seem – and ranking things according to reviews is a key technique of our times – while erasing all the context of their own production. I think you are right to suggest there could be parallels with how teachers are encouraged to engage with data, and the need for them to employ some kind of data literacy to query its provenance. There are important questions here about the labour involved in teaching with data too, if teachers are already having to find ways of incorporating data into their practice. Many advocates of data use in teaching suggest it can increase efficiency. But it also requires other kinds of mundane work and makes new practical, administrative and cognitive demands.