First go at Data Visualisation task – draft
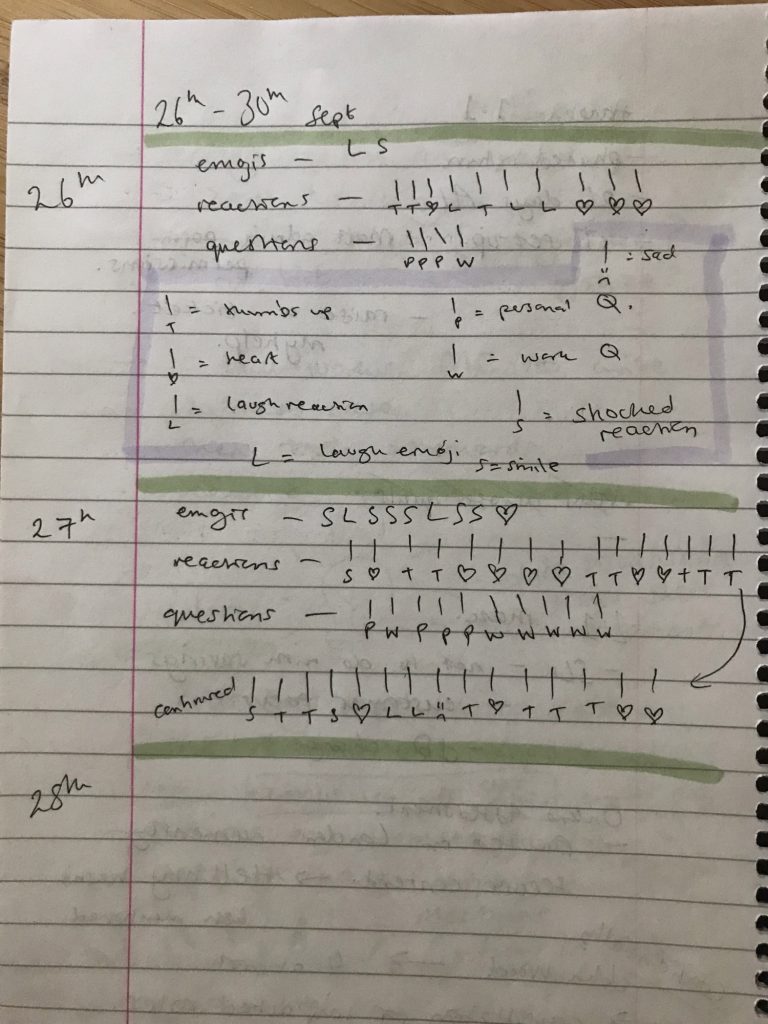
I was reflecting on the nature of working from home, and that other teams within my division will not have as much insight into how my team interact with each other since teams rarely occupy the same physical space since working remotely. I wanted to illustrate the interactions in the teams’ Microsoft Teams chat group by collecting data on emoijis used, reactions and questions.
I am attempting to record a type of behavioural trace data without the context of the actual interaction or conversation akin to critiques of learning analytics data.
Becky, I love the idea of tracing emoji use as a kind of behavioural trace data. I wonder how you might reflect on this in relation to some of the assigned readings on ‘learning with data’ from the course so far. generally speaking, a lot of educational technologies that capture and process learning data will be collecting behavioural traces. Behavioural traces, like your emojis, are quite observable – they can be captured in time spent using a digital service, mouse clicks, keystrokes, quiz questions answered, and other so-called indicators of certain behaviours that are considered ‘proximate’ to learning. How reliable do you think such behavioural traces might be in illuminating whether someone is learning? I was thinking about your emojis here – emojis are easy to observe (as you have done), but they are really very simplified representations. It would be much harder to analyze the actual words used in Teams and the far more complex communicative practices and actions of speaking (or writing in chat). I wonder then if behavioural traces constitute a very very limited account of what learning is? And would being able to conduct sophisticated language processing help illuminate the more complex aspects and processes of learning?