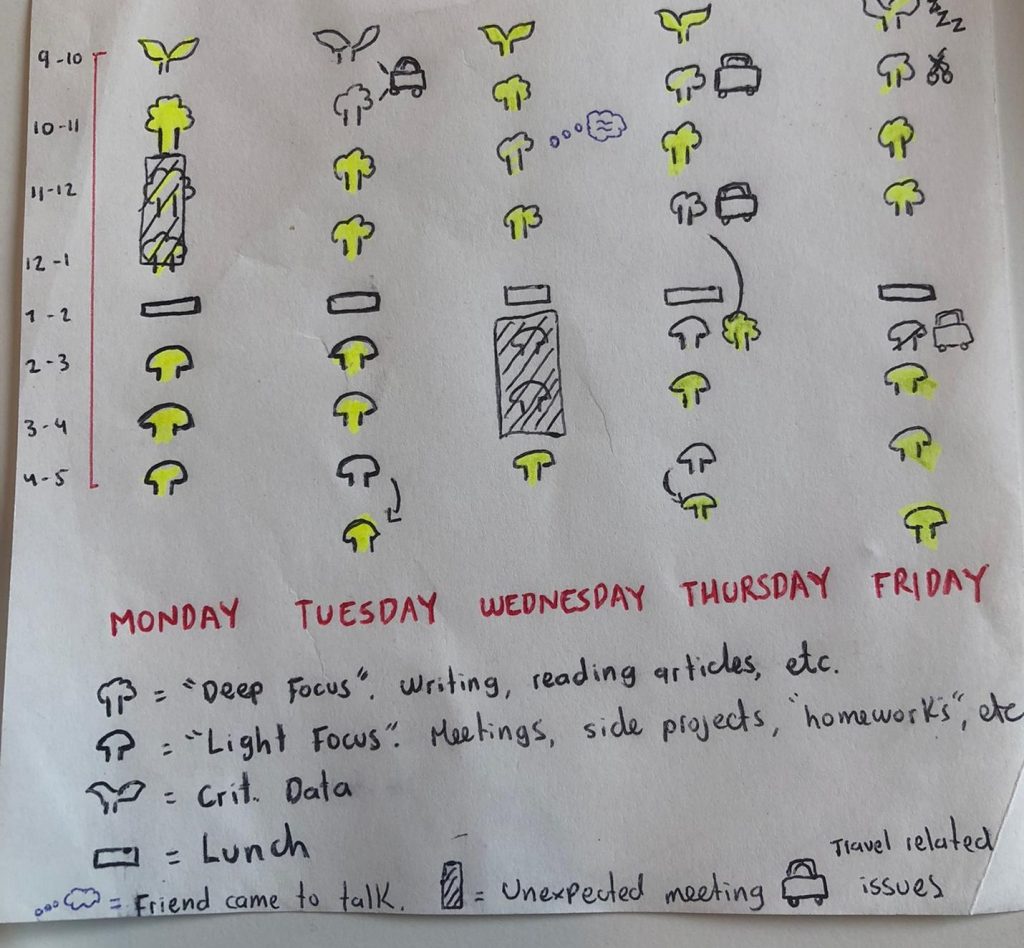
Second Visualization. “After”
I hereby present my second and final visualization for the section Learning with Data. It is a depiction of my week as a student. More precisely, it represents how many chunks of time I was able to remain focused for 45 uninterrupted minutes during each day. I took the idea of representing these chunks of time with trees from the app Forest, which I briefly describe in my previous post. It is easy to notice that my week did not go as planned. Sometimes I had to attend impromptu meetings with my supervisor and my other colleagues, and I also spend quite a lot of time sorting out the logistics of my incoming travel to Edinburgh next Monday. Other times, I did not have more reasons than just a lack of focus or postponing my duties for later in the day.
I wanted to experiment with the idea that data-driven technologies influence educational activities and have the power to frame learners’ choices and decisions (Knox, Williamson & Bayne, 2019). Of course that we are not talking about sophisticated data-intensive practices, but just a piece of paper. However, this piece of paper had the power to act as a normative model for my week as a learner. It is very telling to witness that it still had a big impact on my experience last week. As mentioned by Bulger (2016), personalized learning tools that rely on data usually gather information about the student and analyze it against ideal models of performance, or against the performance of other students. I believe that in a smaller scale, my experiment had the same effect of setting a concrete yet powerful idea of what being a good student means, and such idea governed my actions, my experience and my outcomes during one whole week. Even when I was not nudged to comply with my schedule -a common technique to influence students’ behavior taken from behavioral psychology-, the ideal schedule of a student was constantly in the back of my mind and, in that sense, the time I spent could only take the form of either time well spent (i.e. time complying with my schedule) or time wasted (i.e. time doing something else).
I find it thought-provoking to see how data-intensive learning tools have a significant power to make possible certain learning outcomes, but equally how they have the power to render other educational experiences outside “ideal models” impossible or unlikely. More concretely, it seems difficult that students, teachers, or schools can afford to spend time and effort pursuing educational goals that are against or do not comply directly with the pre-defined goals that inform data-driven learning tools. Some datafied learning experiences seem to be, in a way, determined before they even have started. Once it is clear what they want to achieve, the only remaining question is what is the most efficient way to reach that goal. This idea of education goes against the core of truly educational experiences according to some thinkers, including Hannah Arendt (1954). She sees education as the place where we, as society, protect and take care of the radically new potential that every generation brings to renew the world. This possibility of the new, of the unforeseen, seems to be hindered by educational agendas defined in advance by, say, governments, NGOs, and -as we saw during the last lecture- more recently, big tech companies. It would be interesting to wonder, from a more affirmative stance, if/how certain conceptions of education (Arendt just being one example) can be compatible with the current trends of datafied education.